Transient
Tracers and Tracer Ages
Transient Tracers
Measurements of chemical tracers with time varying sources or sinks
("transient tracers") can provide information on transport time
scales. From measurements of these tracers it is possible to define various
timescales (``tracer ages''). There are several different classes of transient
tracers, and different methods for calculating tracer ages.
One class of tracers are conserved tracers with monotonically increasing (or
decreasing) surface concentrations. Examples of such "chronological
tracers" in the stratosphere include carbon dioxide CO2 and
sulfur hexafluoride (SF6), which both have increasing tropospheric
concentrations and extremely long stratospheric lifetimes. In oceans, lakes,
and groundwater suitable chronological tracers include chlorofluorocarbons
(e.g., CFC-11, CFC-12, and CFC-113) and SF6. The atmospheric
concentration of these chemicals all increased with time until (at least) the
early 1990s (see figure below), and they are also conserved in the above water
bodies.
[Click
on highlighted images for larger view.]
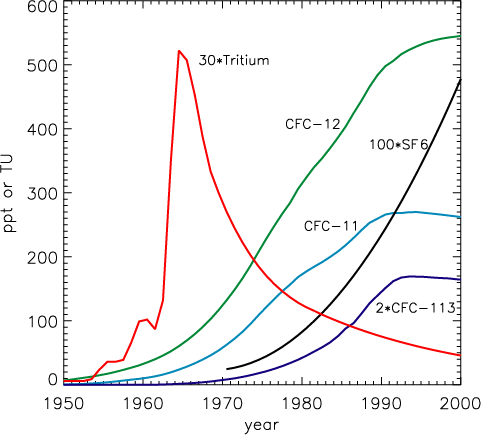
Time
series of atmospheric concentrations, for background air in northern hemisphere
troposphere, of CFC-11, CFC-12, CFC-113 and SF6. Also shown is time
series of tritium in North Atlantic Ocean surface waters.
From the above "chronological" tracers it is possible to a define a
tracer age as the elapsed time since the surface concentration was equal to the
interior concentration, i.e.,
c(t) = c0(t-τ),
where c0 is the surface tracer concentration, and
c the interior concentration. This is illustrated below where stratospheric CO2
measurements are compared with tropospheric time series, and a lag time (or
"age") of 4-5 yrs is determined.
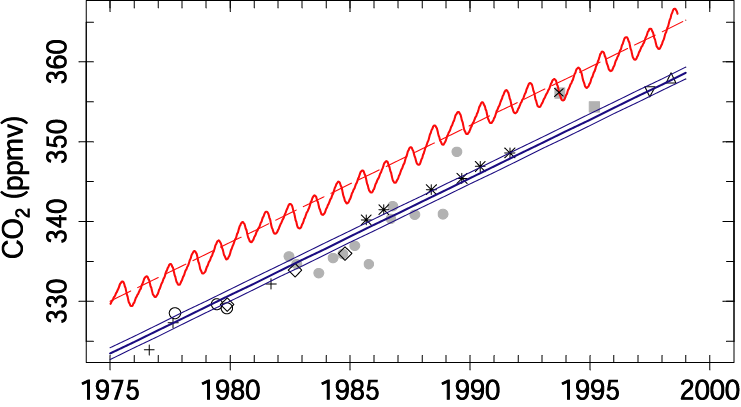
Variation
of observed stratospheric CO2 with time for balloon measurements in
NH middle latitudes. Symbols correspond to average values in region above 20-25
km where there are weak vertical gradients. The shaded curve represents the
stratospheric boundary condition for CO2, and the long dashed line
is a linear fit to this boundary condition. The thick solid line is this fit
delayed by 4.5 year, and the dashed lines correspond to delays of 4 and 5
years. (From Andrews et al. [2001].)}
Stratospheric measurements of CO2 and SF6 have been used
to determine the age of stratospheric air. In
oceans, lakes, and groundwater tracer concentration ages are routinely
calculated from CFC measurements (these ages are often called "pCFC
ages"), see articles by Fine and Plummer and
Busenberg for reviews of ocean and groundwater research, respectively.
The ratio of certain CFCs has also increased monotonically (e.g., CFC11/CFC12
ratio until 1980) and this ratio can be used to define a "ratio" age
in a manner analogous to the above concentration age, i.e., the ratio age is
the elapsed time since the ratio of two tracers at the surface was equal to the
interior ratio.
Another class of transient tracers are those whose mixing ratios vary
periodically. One can define an age, or "phase lag time", from the
lag time of a maximum (or minimum) in the time series at an interior location
from that at the boundary. Two such tracers in the stratosphere are CO2
and H2O, both which have annual cycles. The annual cycle in
stratospheric CO2 is forced by the annual cycle in surface CO2,
the result of seasonal variations in biota sources and sinks. The cycle in H2O
is forced by the annual cycle in tropical tropopause temperatures which
regulates (via dehydration) the values of H2O entering the
stratosphere. The vertical propagation of the annual cycle in H2O in
the tropical stratosphere is shown below, from which a phase lag time of around
1 yr at 28 km can be determined.
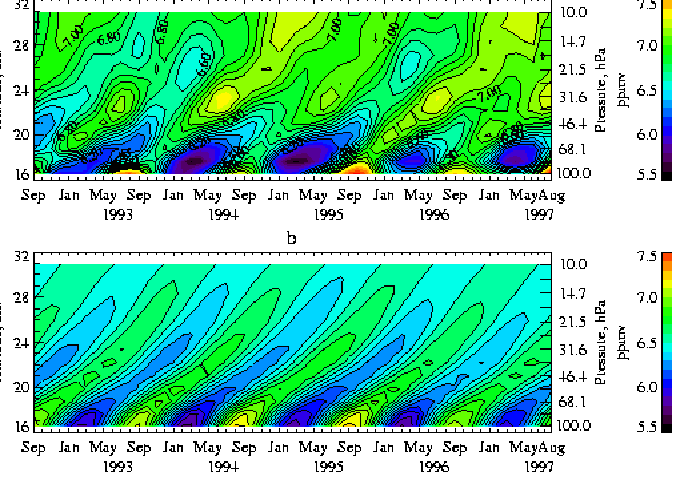
Height-time
variation of HALOE measurements of water vapor in the tropical stratosphere.
From Mote et al. (1998).
Another class of transient tracers measured in oceans, lakes, and groundwater
are those undergoing radioactive decay, e.g., tritium, argon, natural
radiocarbon. If the surface concentration is approximately constant in space
and time then a ``radioactive" tracer age can be defined as
τ = λ-1ln
(c0/c),
where
c0 is the surface tracer concentration, c the interior concentration
and λ the tracer decay constant. As there are significant temporal
variations in the surface concentration of tritium, due to atmospheric bomb
testing in the mid-1960s (see plot above), a modified form has to be used to
define an age from tritium and its daughter product helium-3:
τ = λ-1
ln { (3H + 3He) / 3H },
where 3H is trituim concentration, 3He
is the helium-3 that has come from tritium decay, and λ is the decay
constant of tritium. Tritium-helium ages have been calculated from measurements
in oceans, lakes, and groundwater, see, e.g., WHOI-HIL webpage.
Relationship among tracer ages
In general, the ages derived from different transient tracers differ. For
example, the plot below compares ages in the tropical stratosphere derived from
a chronological tracer (CO2) and from a periodic tracer (H2O).
The phase lag time is younger than the concentration age throughout the
stratosphere with large differences in the upper stratosphere.
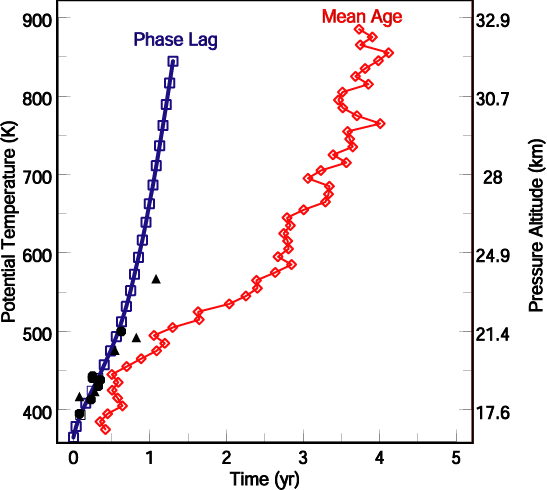
Vertical
profiles of "mean age", dervied from CO2 measurements, and
"phase lag" time, derived from H2O measurements, in the tropical
stratosphere.
The ages from tracers differ even for the same class of tracers. This is
illustrated below for tracer ages derived from measurements of CFCs and SF6
in Lake Issyk-Kul.
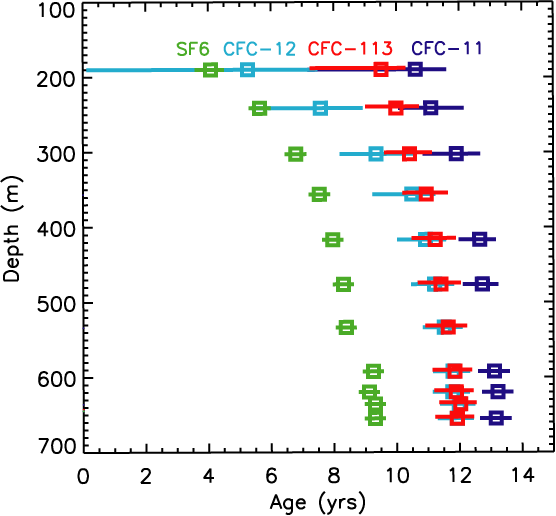
Vertical
profiles of tracer ages derived from measuements in Lake Issyk-Kul (Vollmer et
al. 2000).
The differences between the different tracer ages are a result of mixing and
the existence of a distribution of transit times. Each tracer, because of its
different boundary condition or decay rate, weighs features of the distribution
differently and so in general different tracers yield different ages. The
variations of several different tracer ages with width Δ, for mean age
Γ = 25 yrs, is shown below. For Δ=0 all tracer ages equal the mean
age, but for Δ > 0 the tracer ages are younger than the mean age and
different tracers yield different ages. The larger Δ, corresponding to
more mixing, the larger the difference between tracer ages.
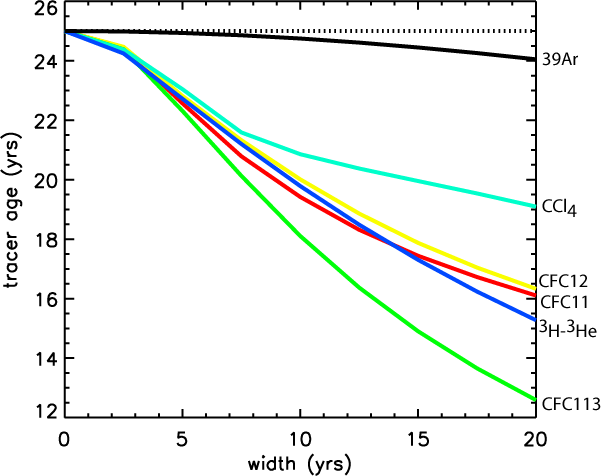
Variation
of tracer age (in 1991) with width Δ for Γ=25 yrs, for several
halocarbons (CFC-11, CFC-12, CFC-113 and CCl4) concentration ages,
and tritium-helium and argon radioactive tracer ages. Note that y-axes cover
only 10 to 26 yrs.
The differences between the tracer ages shown above can be understood in terms
of the differing growth rates of the tracers (see Transit
Time Distributions Section). For the 20-yr period before 1991 CFC-113 had
the fastest growth rate, CCl4 the slowest, and CFC-11 and CFC-12 had
similar growth rates. Thus CFC-113 age < CFC-11 age < CFC-12 age < CCl4
age. The relationship of different tracer ages with CFC-11 ages for a wide
range of Γ and Δ is shown below. These plots show that the age-age
relationships depend on both the tracers and the TTD. For more discussion of
relationships among tracer ages see Waugh et al., JGR, 2003 .
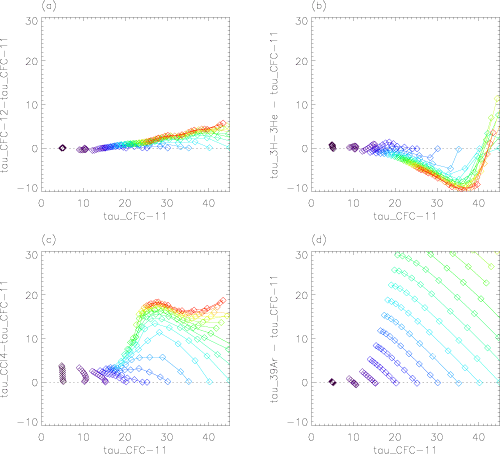
Relationships
between CFC12, tritium-helium, CCl4, and argon ages with CFC11 age
(y-axis shows the difference in the two tracer ages). The different curves
correspond to different mean ages (Γ = 5, 10, ..., 100 yrs), and symbols
to the different widths (Δ varies from 0 to Γ in 10 equal intervals).
The symbols on the horizontal dotted line correspond to Δ = 0 whereas
those at the end of the curves correspond to Δ = \Γ.
The plots above show that there can be significant differences between ages
derived from different tracers. While this complicates the interpretation of
single age measurements, it does raise the possibility of using tracer ages in
combination to constrain the TTD. In particular ages from two tracers can be
used to determine the first two moments of the TTD (i.e. the mean age and
width). This approach has been used to constrain the TTDs in Lake Issyk-Kul and in the subpolar North Atlantic Ocean .
Back to Transit Times in Geophysical Flows.